
SENSOR-BASED IIOT PLATFORM

Turn Factory Data into Operational Value

Connect your existing machines and production lines via sensors, collect industrial data in real time, and convert production activity into clear, measurable information.

Connect existing machines through an independent sensor-based data layer No production downtime Start with one machine
RAHVA — Line 2 ViewLive
Today's production (units)12,483
Current-shift OEE 0 %
Active downtime 0 minutes
Press 1 · RunningPress 2 · RunningInjection 3 · StoppedPackaging · Mold Change
Sensor S-104 · Connected
DAQ-04 · Online
01
ConnectCONNECT
02
MonitorMONITOR
03
MeasureMEASURE
04
UnderstandUNDERSTAND
05
ImproveIMPROVE
01 / The challenge

Production is running;
but can you see everything?

In many factories, machines are already generating valuable data — but that information is either not captured, or reaches decision-makers late and in fragmented form.
  • Manual production recordingProduction figures are recorded on paper, introducing delays and human error.
  • Limited real-time visibilityThere is no unified view of the real-time status of machines and lines.
  • Fragmented production informationData remains siloed across people, shifts, and reports.
  • Unrecorded downtimeDowntime duration and causes are not measured and recorded accurately.
  • Difficult historical analysisWithout a recorded history, trend analysis and period comparisons are impossible.
  • Delayed performance reportingProduction performance reports are prepared with a delay, not at the moment of need.
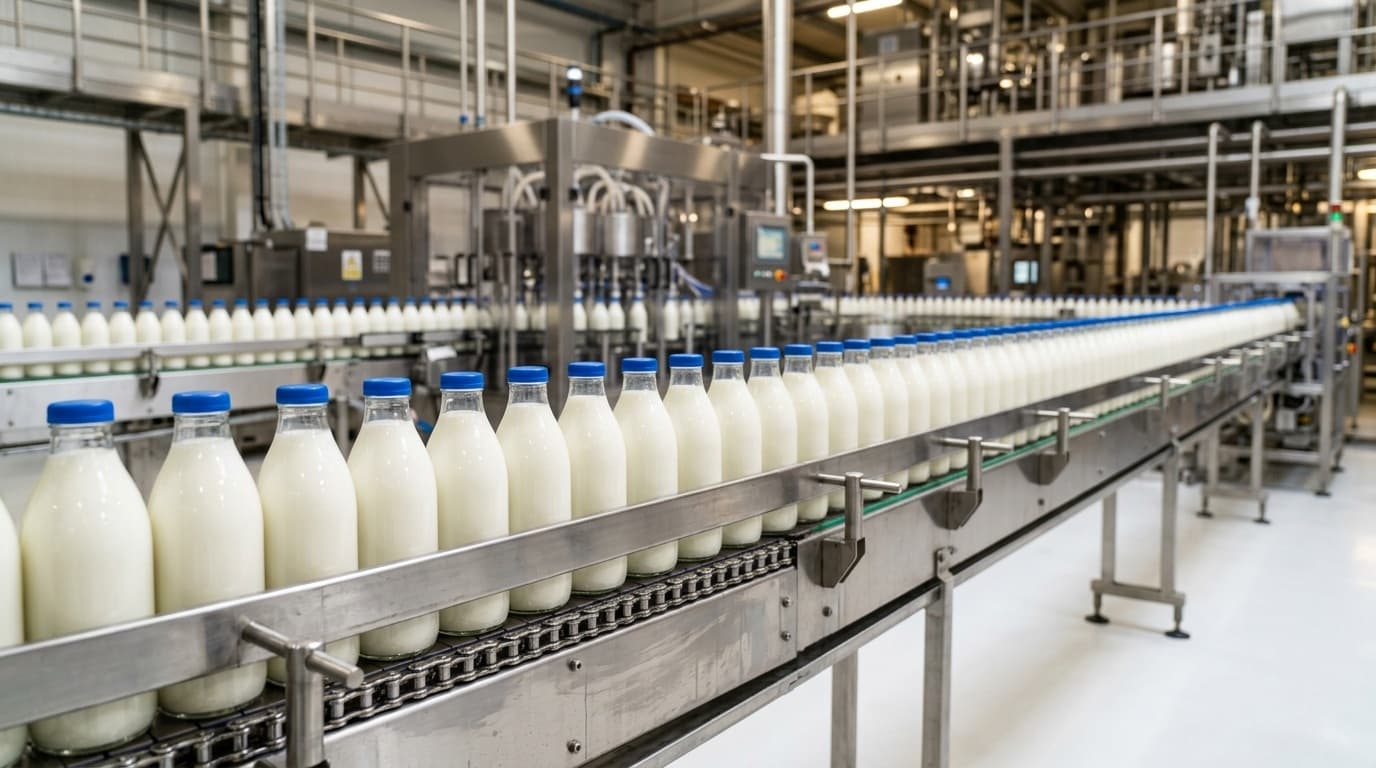
Production floor
Unrecorded downtime12 minutes — no reason recorded
Manual countingRecorded on paper forms
Missing dataNot handed over between shifts
02 / The approach

Connect the physical factory to the digital world

The platform architecture provides a clear path from the physical machine to the management dashboard — each layer has a distinct role.

LAYER 01

Existing machines and production lines

Your current factory equipment — with no replacement needed.

LAYER 02

Added sensors

Installed on machine bodies to measure status, cycles, and production activity.

LAYER 03

Data acquisition device

Reads sensor data and securely sends it to the platform.

LAYER 04

Rahva IIoT platform

Centralizes industrial data, calculates KPIs, and stores historical records.

Real-time monitoringReal-time status of machines and production
Historical data and analysisTrends, downtime, and period-over-period comparisons
Dashboards and reportsClear views tailored to each role in the organization
The entire path is added alongside your existing automation — nothing in the control layer is altered.
03 / Key deployment advantage

Built around the factory you already have

The platform collects machine and production data through its own sensors and acquisition devices — independently of the machine's existing control system. This enables digital monitoring without interfering with current automation, which is one of the most important advantages of this deployment approach.

Existing factory control

As-is
  • Machine control and automation system
  • Existing equipment operating logic
  • Current production-floor workflows

New digital monitoring layer

Added on top
  • Sensors installed on machines
  • Data acquisition devices
  • IIoT platform, dashboards, and reports

Existing machines keep running— No need to stop or rebuild equipment.

Existing automation is not part of the data path— Data collection is fully independent.

Digital monitoring is a separate layer— Addable, expandable, and independent.

Technical details about separating the control and monitoring layers are explained on theTechnology page.

04 / Platform capabilities

What the platform delivers

Eight core capabilities that turn industrial data into actionable information for the production floor and management.

Machine monitoring

Real-time visibility into the operating status of connected machines.

Production monitoring

Track production counts, rates, targets, and activity.

Production line monitoring

View multiple machines as one integrated production system.

Downtime monitoring

Measure machine downtime and production interruptions.

Performance analysis

Analyze machine, line, and shift performance.

Historical data

Understand production behavior over time.

Industrial dashboard

Transform industrial data into clear visual interfaces.

Reporting

Structured production and performance reports.

05 / Dashboard

A window into factory operational data

The platform dashboard is built for real production decisions — with KPIs, machine status, and trends that actually matter on the factory floor. The data below is illustrative.

RAHVA — Factory OverviewLine 2 · Assembly ▾
Live --:--
Today's production (units)
12,483
Current-shift OEE
0%
Active downtime
0minutes
Active machines
0of0
Hourly production — Line 2units / hour
810121416
Achievement vs. daily target89%12,483 / 14,000
Machine status8 connected machines
  • Press 1Running
  • Press 2Running
  • Injection 3Downtime · 12 min
  • Injection 4Running
  • CNC machining 5Running
  • Heat treatment furnaceRunning
  • Assembly line 7Running
  • Packaging 8Die changeover
Shift performance — productionToday
Morning
4,820
Afternoon
4,410
Night (current)
3,253

Each role gets a tailored view: floor operator, shift supervisor, and plant manager.

06 / Data journey

From sensor to operational improvement

The platform creates value through a five-step journey — from the moment a sensor detects a physical signal to the decision that improves performance.

01

Sense

Sensors collect physical data from the machine.

02

Collect

Acquisition devices aggregate and transmit the data.

03

Monitor

The platform provides real-time visibility into production.

04

Analyze

Historical data reveals patterns in performance and downtime.

05

Improve

Teams identify opportunities for operational improvement.

07 / Real-time and historical

Know what is happening now and understand what has happened before

NOW — REAL-TIME

Real-time

Machine status7 / 8 RUNNING
Current production12,483 PCS
Sensor values63°C · 2.4 mm/s
Current downtime00:23 MIN
Line statusLINE-2 · ACTIVE
HISTORY — ANALYSIS

Historical

Production trends12-WEEK TREND
Downtime historyEVENT LOG
Performance comparisonPERIOD vs PERIOD
Shift comparisonSHIFT vs SHIFT
Historical sensor dataARCHIVED SIGNALS

The platform is more than just a real-time dashboard —it combines a monitoring system and a production data analysis tool in one place.

08 / Production performance

Industrial data enables measurable performance

The platform converts physical production activity into clear KPIs — the numbers that matter in production and management meetings.

Today's production count
0units
Production rate
0units/hour
Machine productivity
0%
Runtime
6:42 hours
Total shift downtime
0minutes
Average cycle time
0seconds
Daily target achievement
0%
Best shift performance
Morning 4,820 units
Target vs. achievement — today
12,483 of 14,000 units
89%

The values above are illustrative examples for demonstrating platform capabilities.

09 / Downtime

Make production losses visible

Every minute of downtime is lost production. Automatically collected data provides an accurate, continuous picture of production interruptions — without depending on manual records.

Machine running Machine stopped Historical analysis

Morning shift timeline — Line 2 Illustrative example · 8 hours

Running Downtime Die changeover / setup
10 / Use cases

What do you monitor in practice?

01

Machine status

Know instantly whether each machine is running or stopped.
02

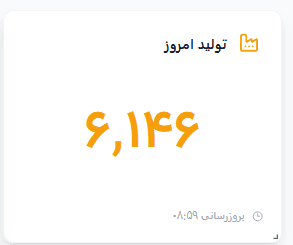
Production counting

Automatically collect production data without manual entry.
03

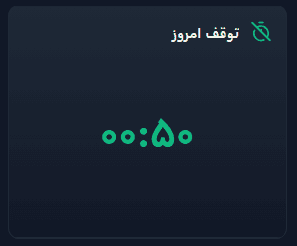
Production downtime

Measure production interruptions and their causes.
04

Cycle time

Monitor machine cycle behavior and deviations.
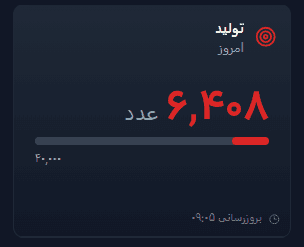
05

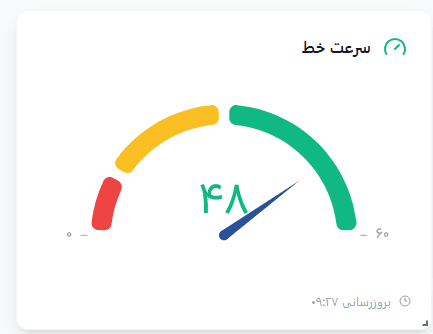
Production rate

Track production speed and variance from target.
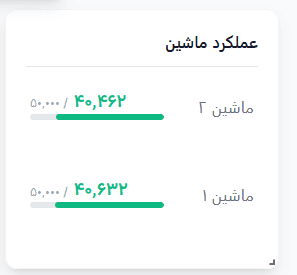
06

Line monitoring

View multiple machines together at the line level.
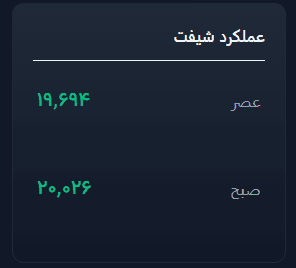
07

Shift performance

Compare production across work shifts.
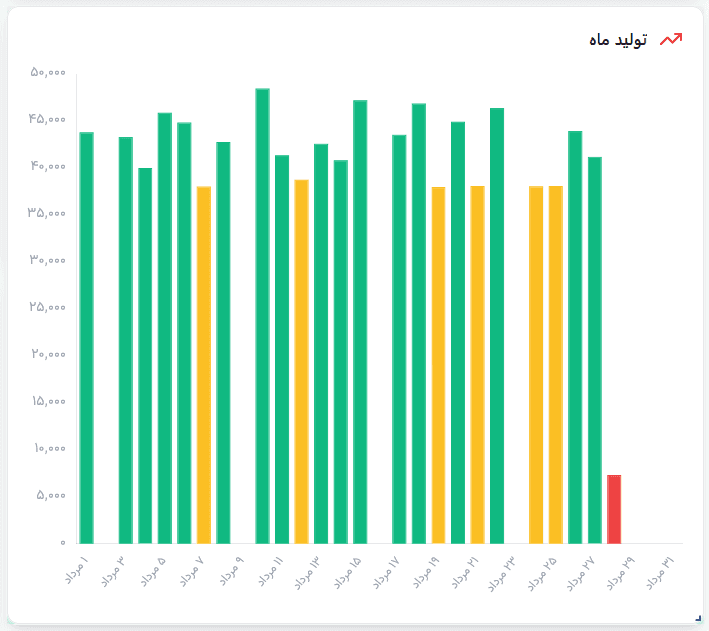
08

Historical analysis

Identify trends and recurring patterns.

11 / Scalability

Start small; scale across the entire factory

Digitalization doesn't have to start as a large-scale project. You can begin with a focused deployment and expand the scope based on the results.

S1

One machine

Pilot starting point

S2

Several machines

Similar key equipment

S3

Production line

Full line monitoring

S4

Production area

Multiple lines together

S5

Entire factory

Complete coverage

12 / Target industries

For real production environments

We focus on industries where we actually deploy and understand the language of production.

General manufacturingMachinery manufacturingAutomotiveMetalworkingPackagingPlasticsFood industry
13 / Future roadmap

The foundation of the smart factory

A smart factory cannot be built on unreliable data. The platform today builds the data foundation that tomorrow's advanced capabilities will rely on.

Today — data foundationAVAILABLE NOW

Current platform capabilities

SensorsIndustrial dataMonitorMeasureAnalyze

Future — upcoming expansionsFuture

Future development direction; not current platform capabilities

Advanced analyticsArtificial intelligenceAutomationRobotics

This section represents a future development vision. Today, our focus is on building the reliable data foundation that every factory needs for its next steps.

14 / Get started

Start with one machine;
build from there

Tell us about your machine, production line, or monitoring challenge, and we'll explore how industrial data can clarify your view of production. No enterprise-wide transformation is needed from day one — the pilot can be just one machine or one line.

  • An initial discussion about your equipment and goals
  • On-site technical assessment and selection of a starting point
  • Sensor installation without stopping production
  • See live data and make decisions based on real results

Request a consultation / pilot project

Fill out the form and our technical team will reach out for initial coordination.

Your information will only be used to respond to this inquiry.